What each machine last told us, and how long ago
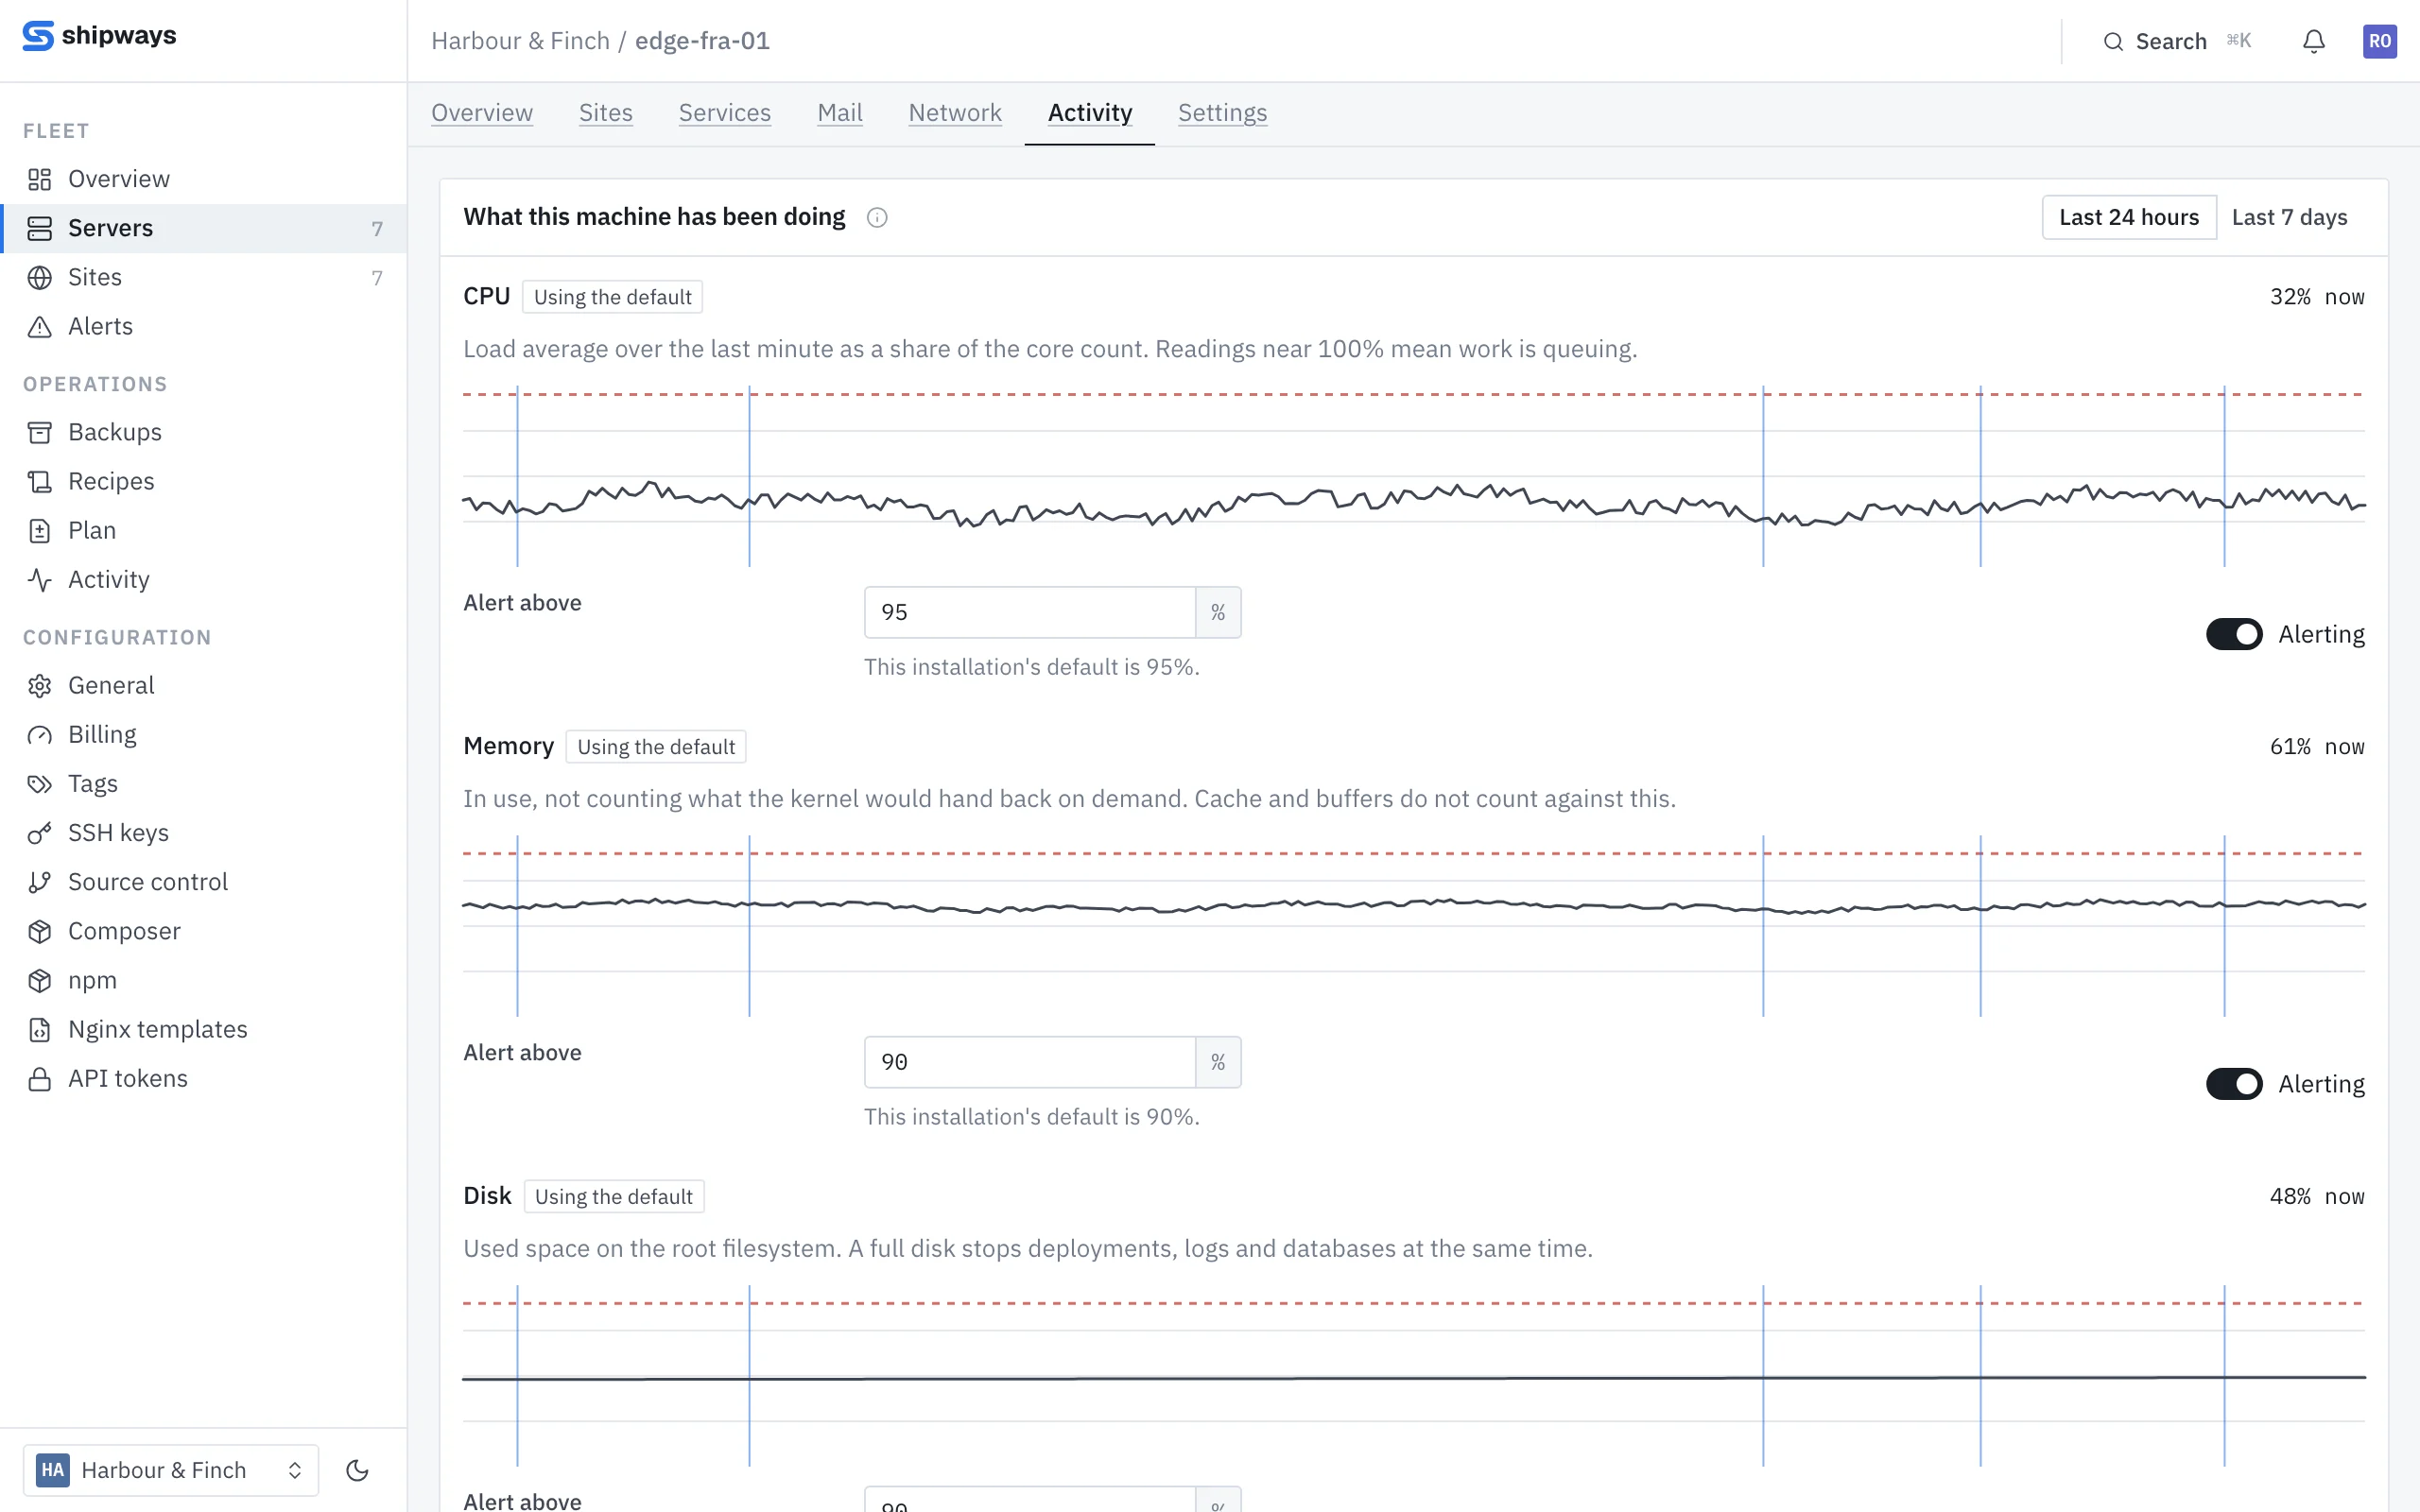
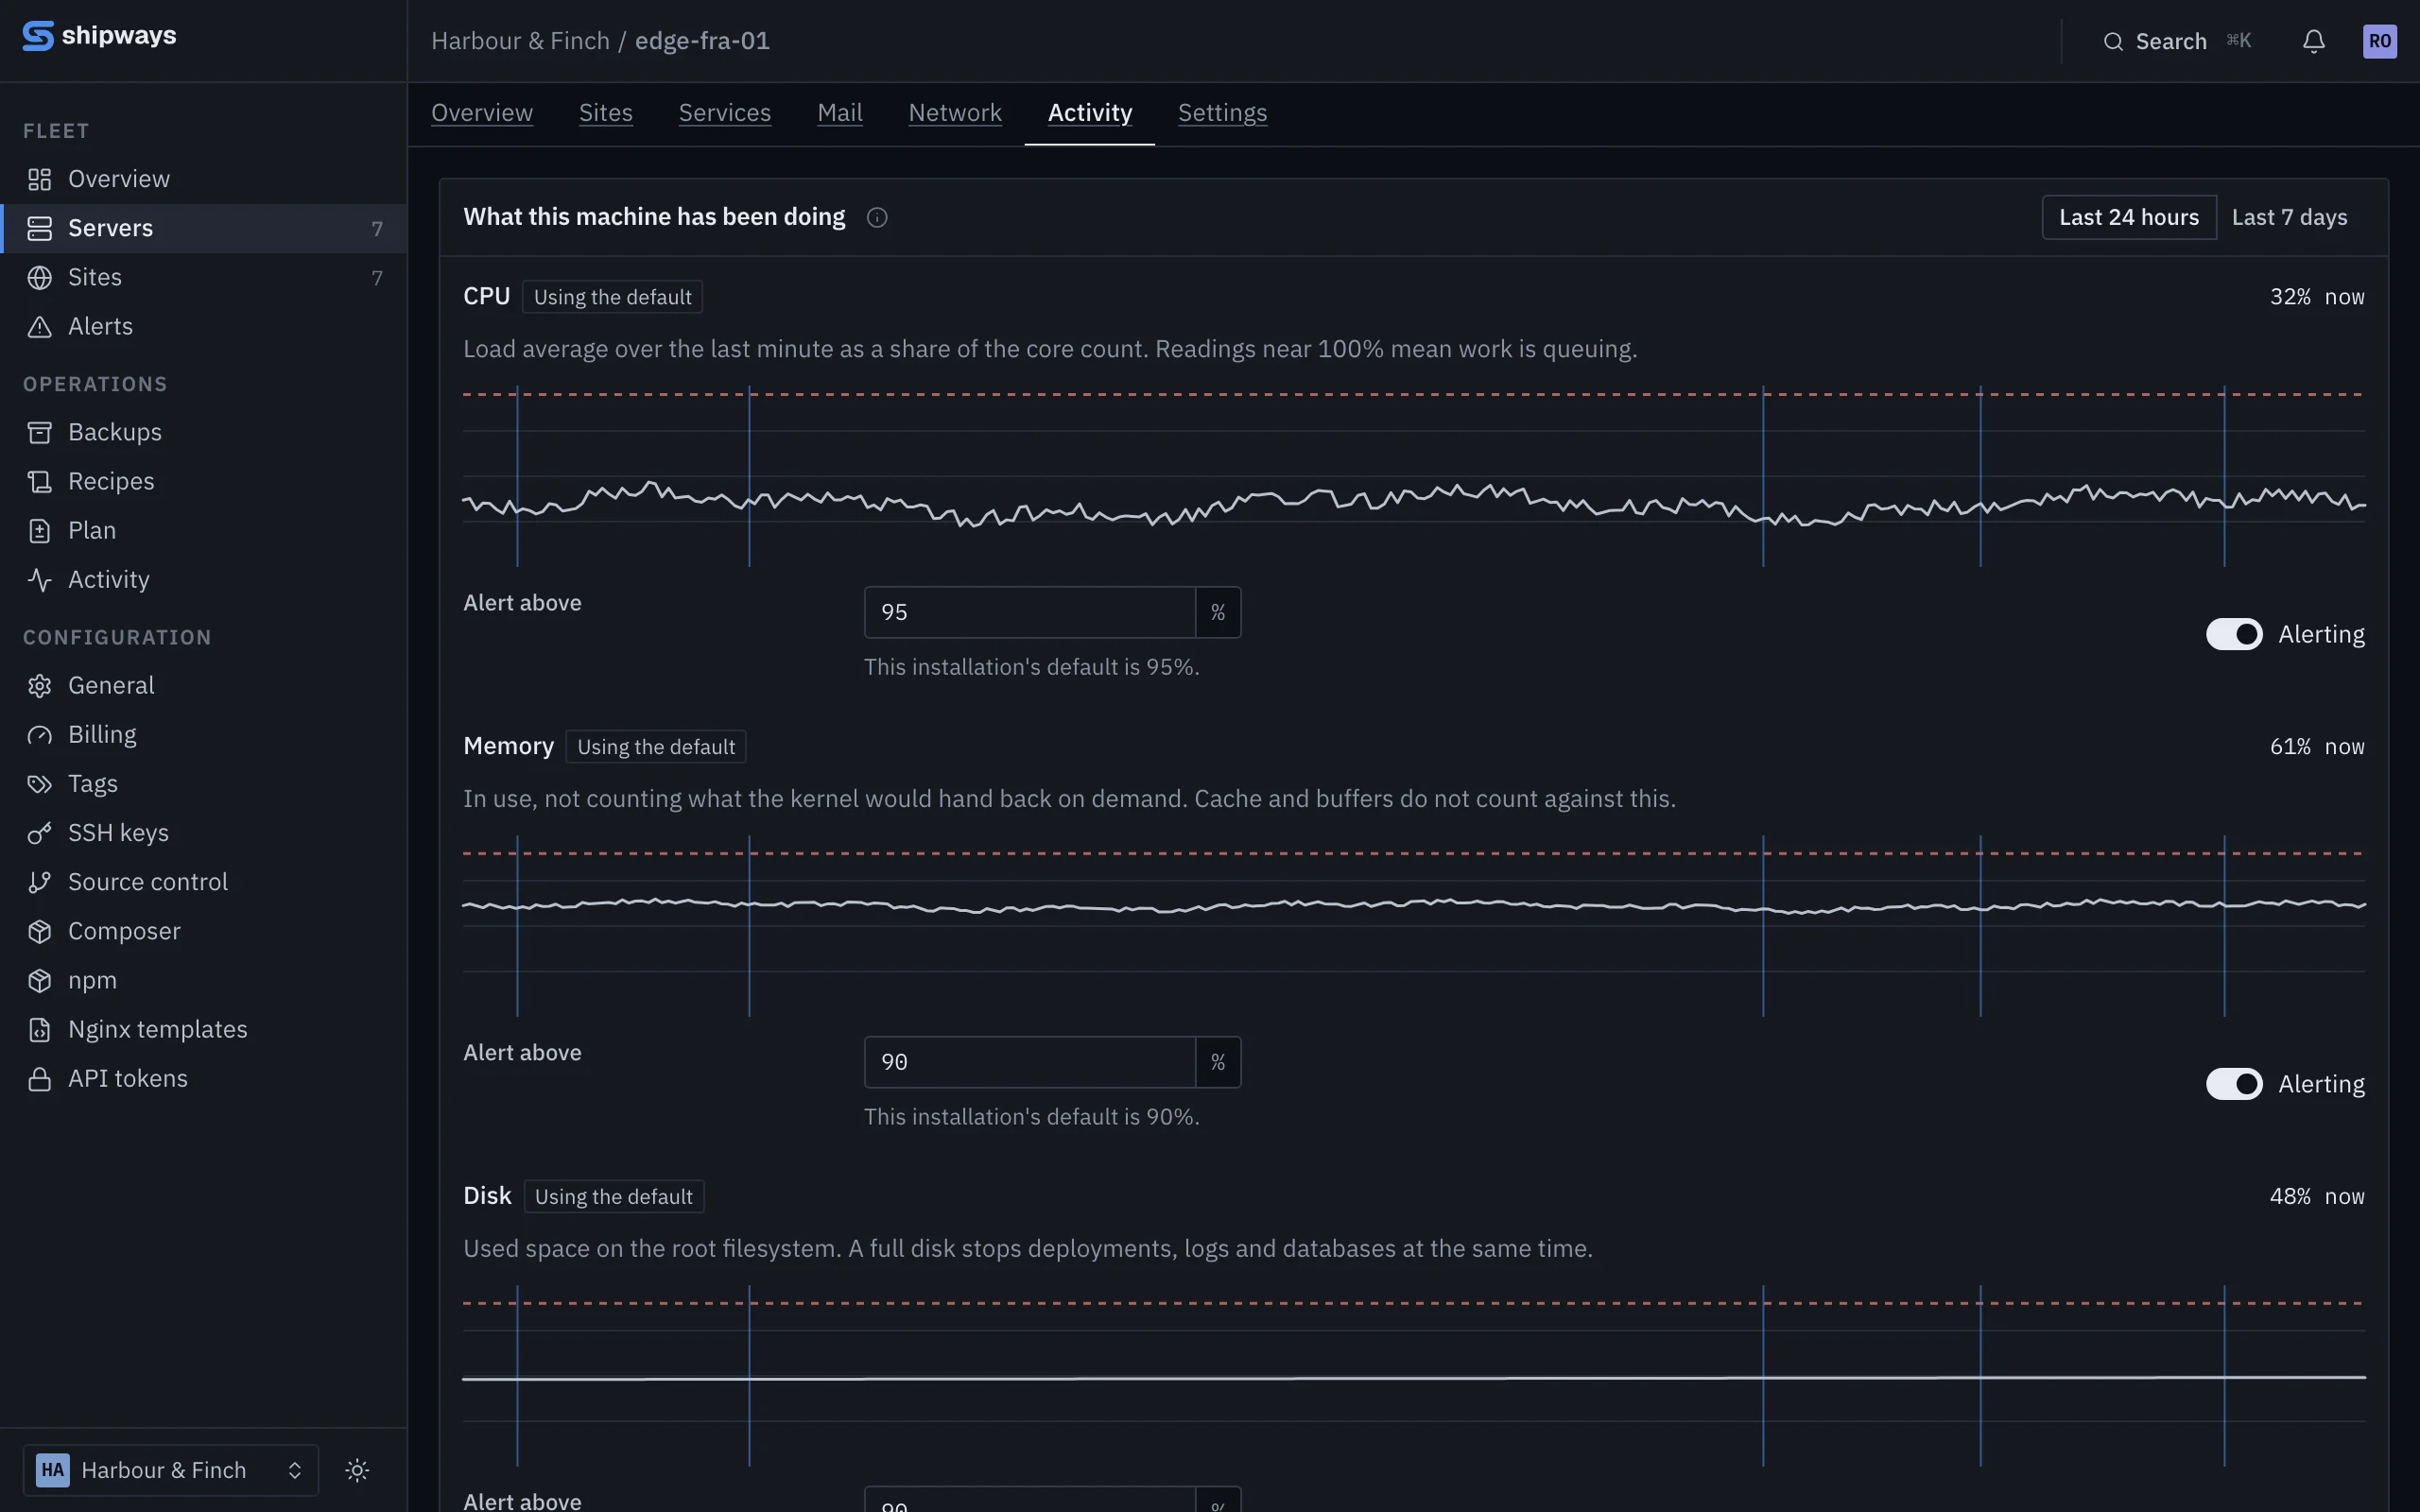
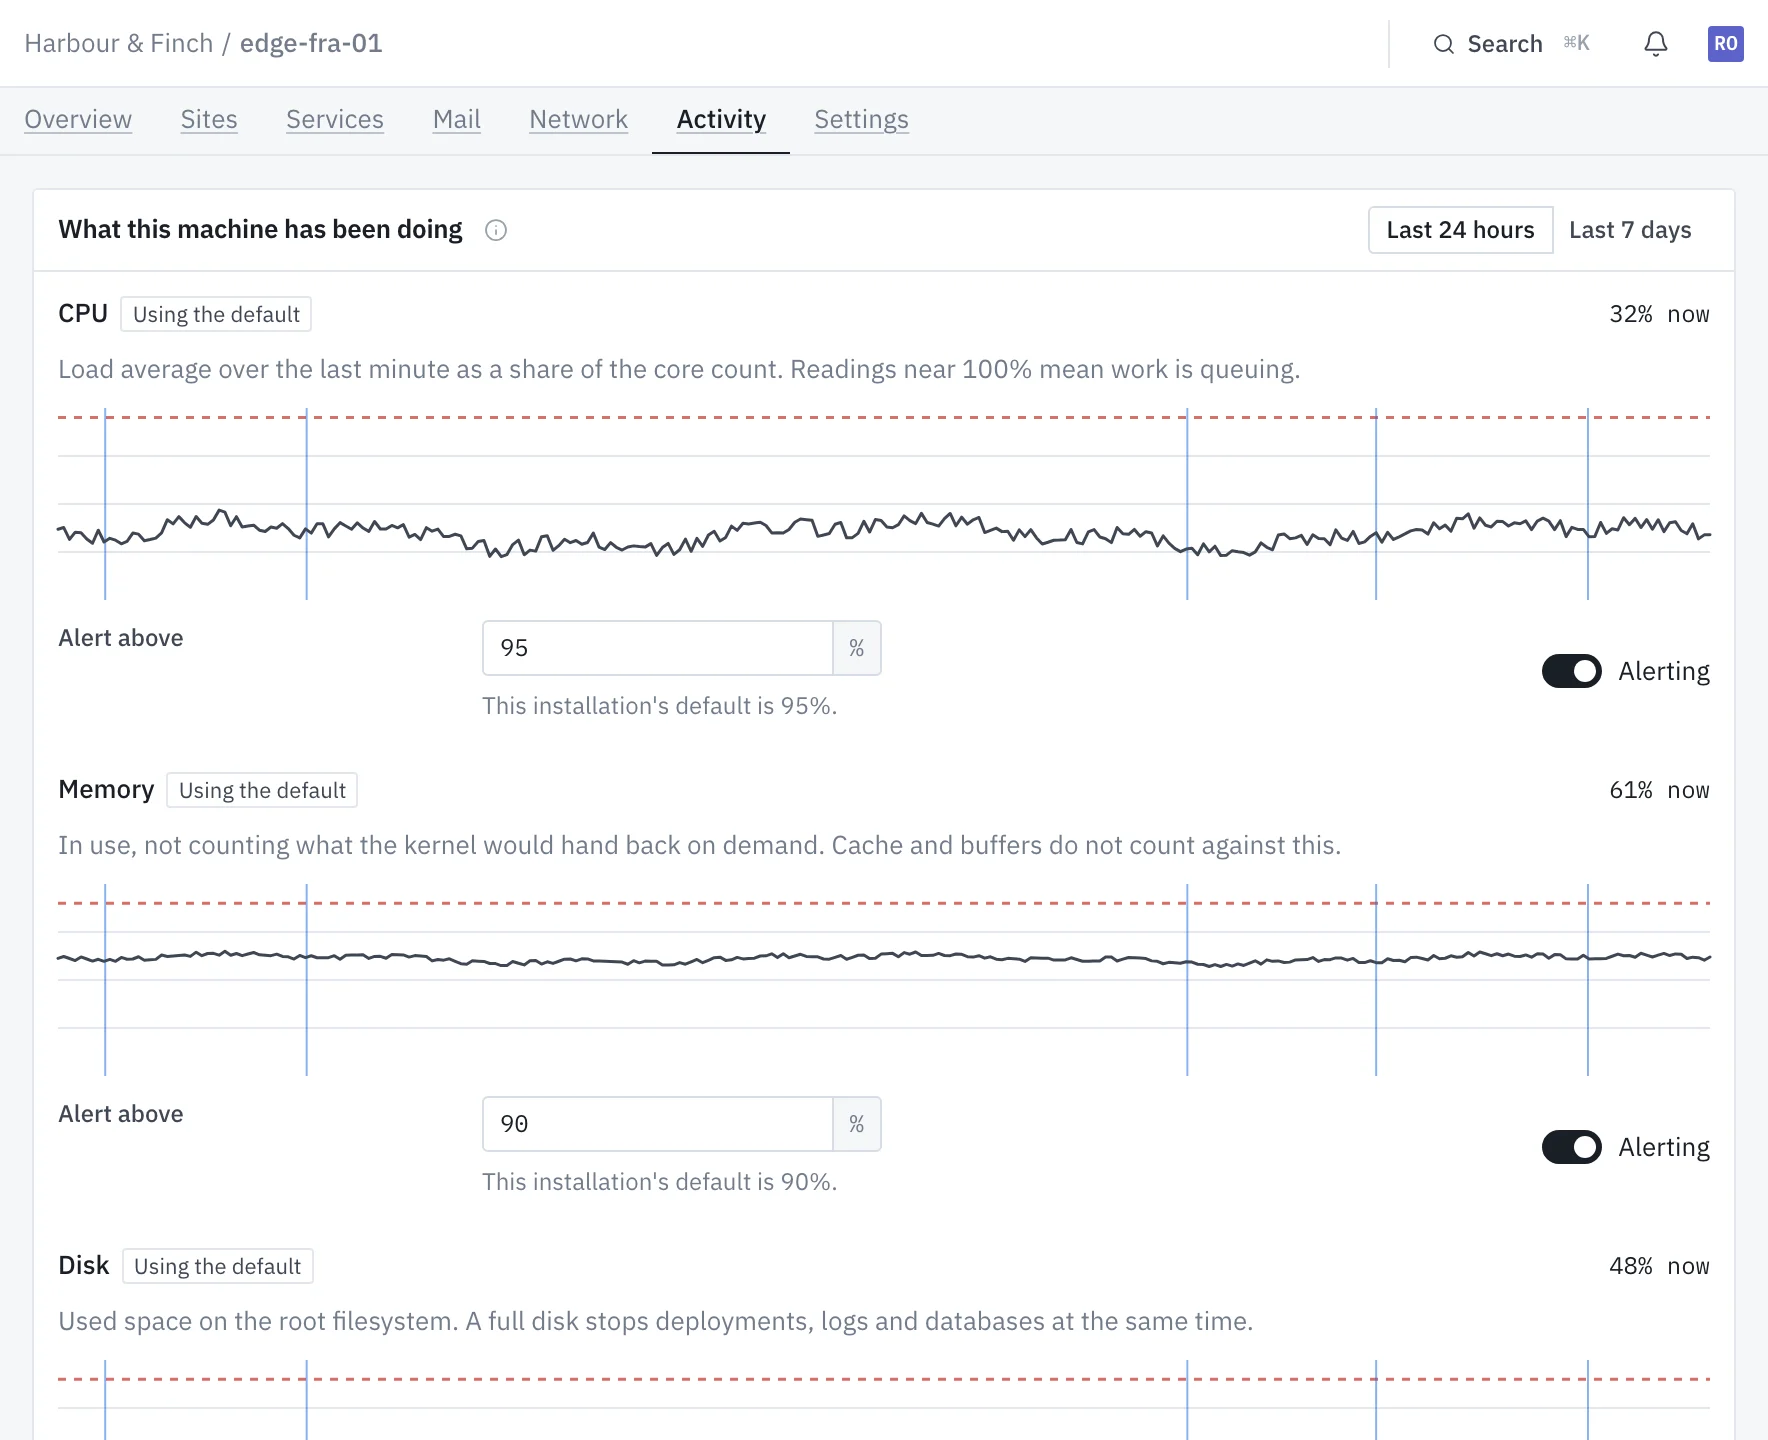
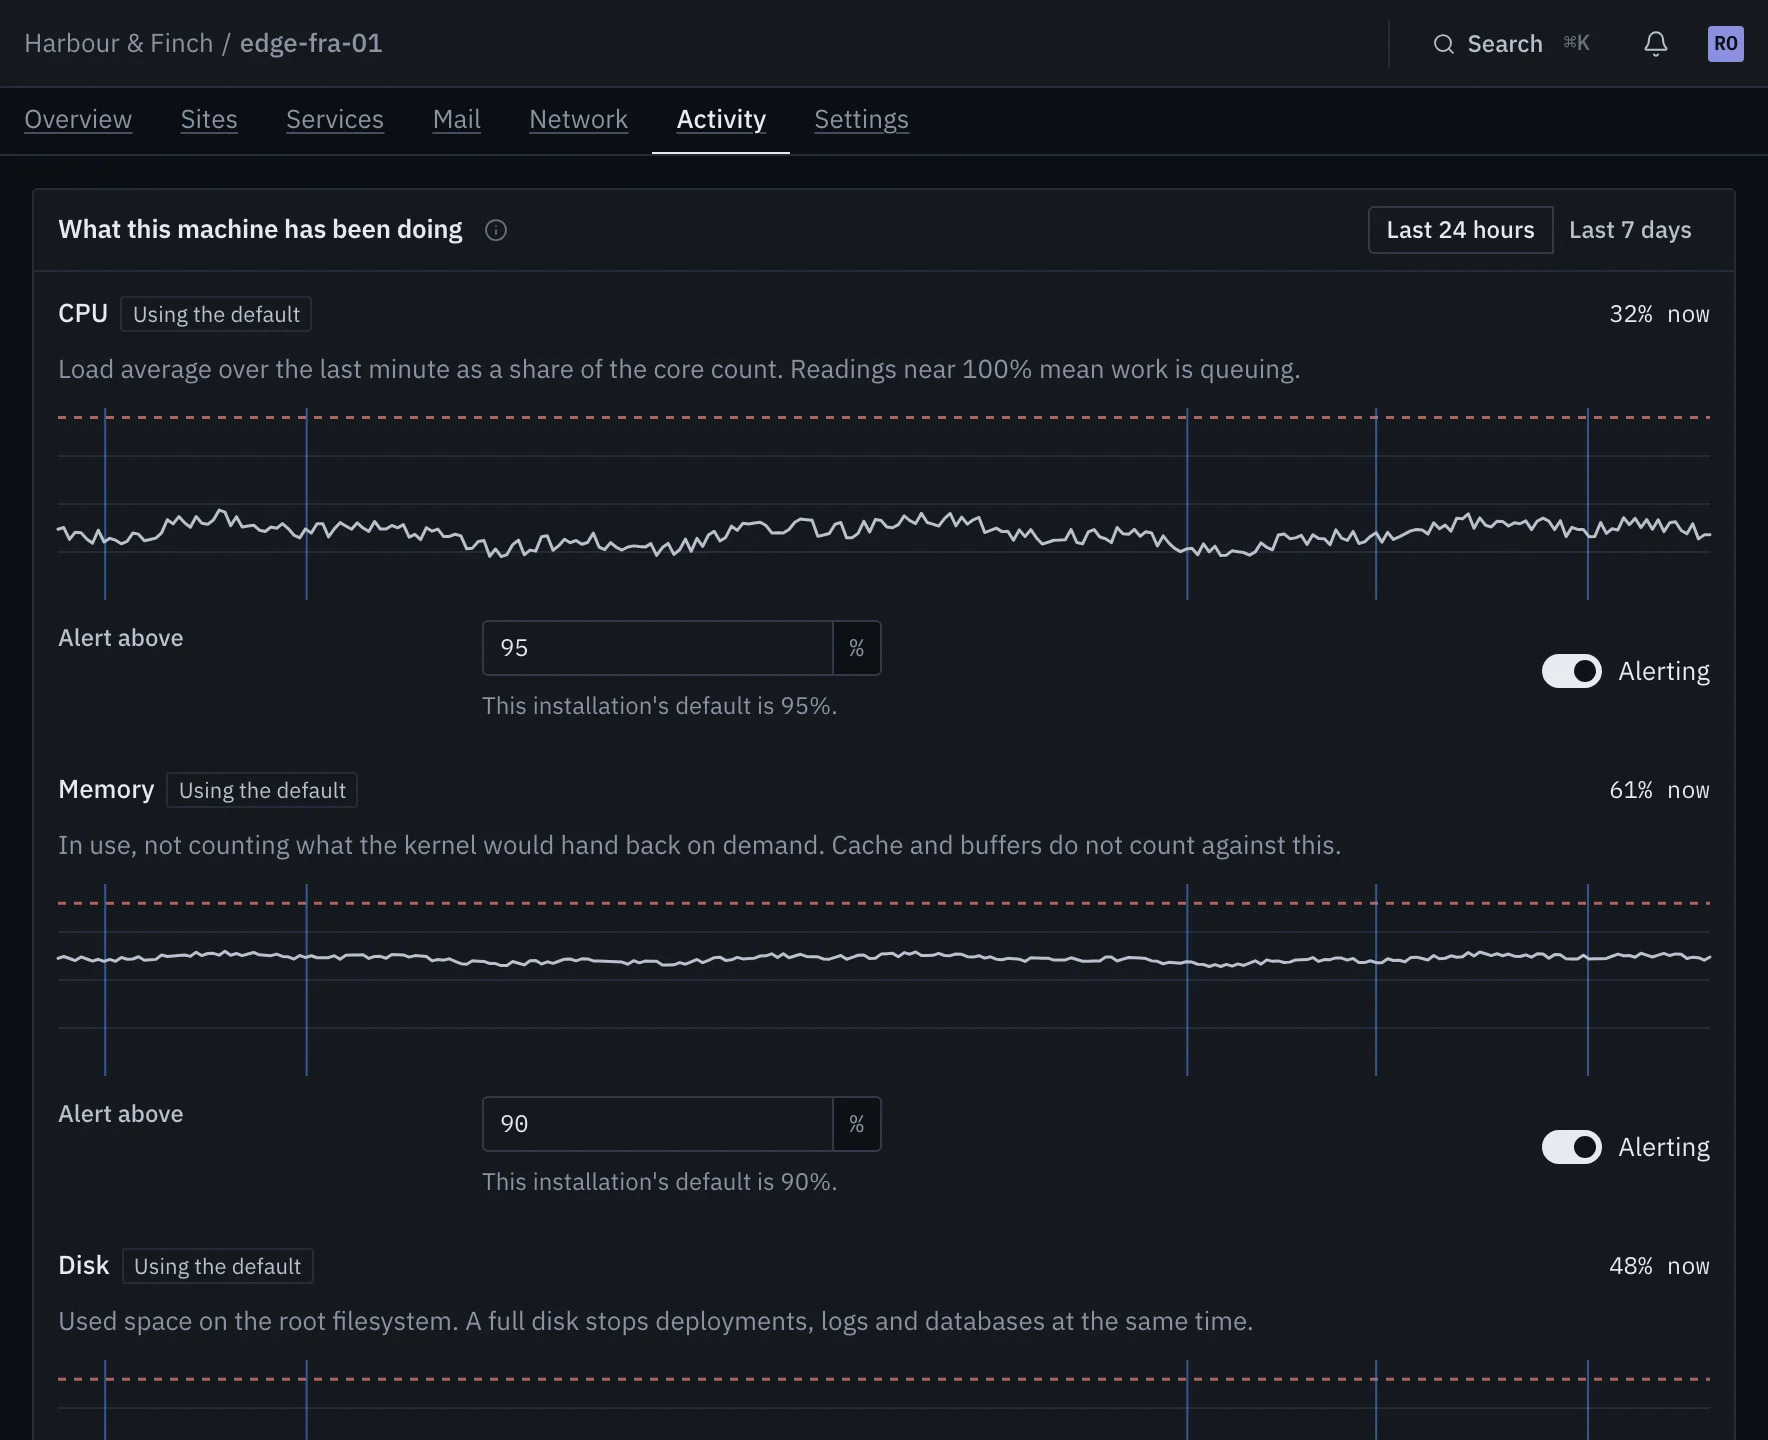
CPU, memory and disk from every check-in, against thresholds you set, with every deploy marked on the chart. When something changes, the people who need to know are told once.
Readings with their age attached
The agent reports CPU, memory and disk every time it checks in. CPU is the one-minute load as a share of the cores; memory leaves out what the kernel would hand back; disk is the root filesystem. Samples are kept for seven days, and every deploy on the machine is drawn on the chart where it happened.
- Alert above 90% disk, 90% memory or 95% CPU, or the numbers you set per server
- Optional collectors for PHP-FPM pools, nginx requests, slow queries and Redis queue depth
- When the agent goes quiet, the last readings are shown as exactly that
A quiet machine is unknown, not broken
After two minutes without a check-in a machine is shown as unreachable, and its numbers move onto the hatch. The panel cannot reach in to find out why, so it says what it knows: when it last heard, and what it was told then. The band stays until the machine checks in again.
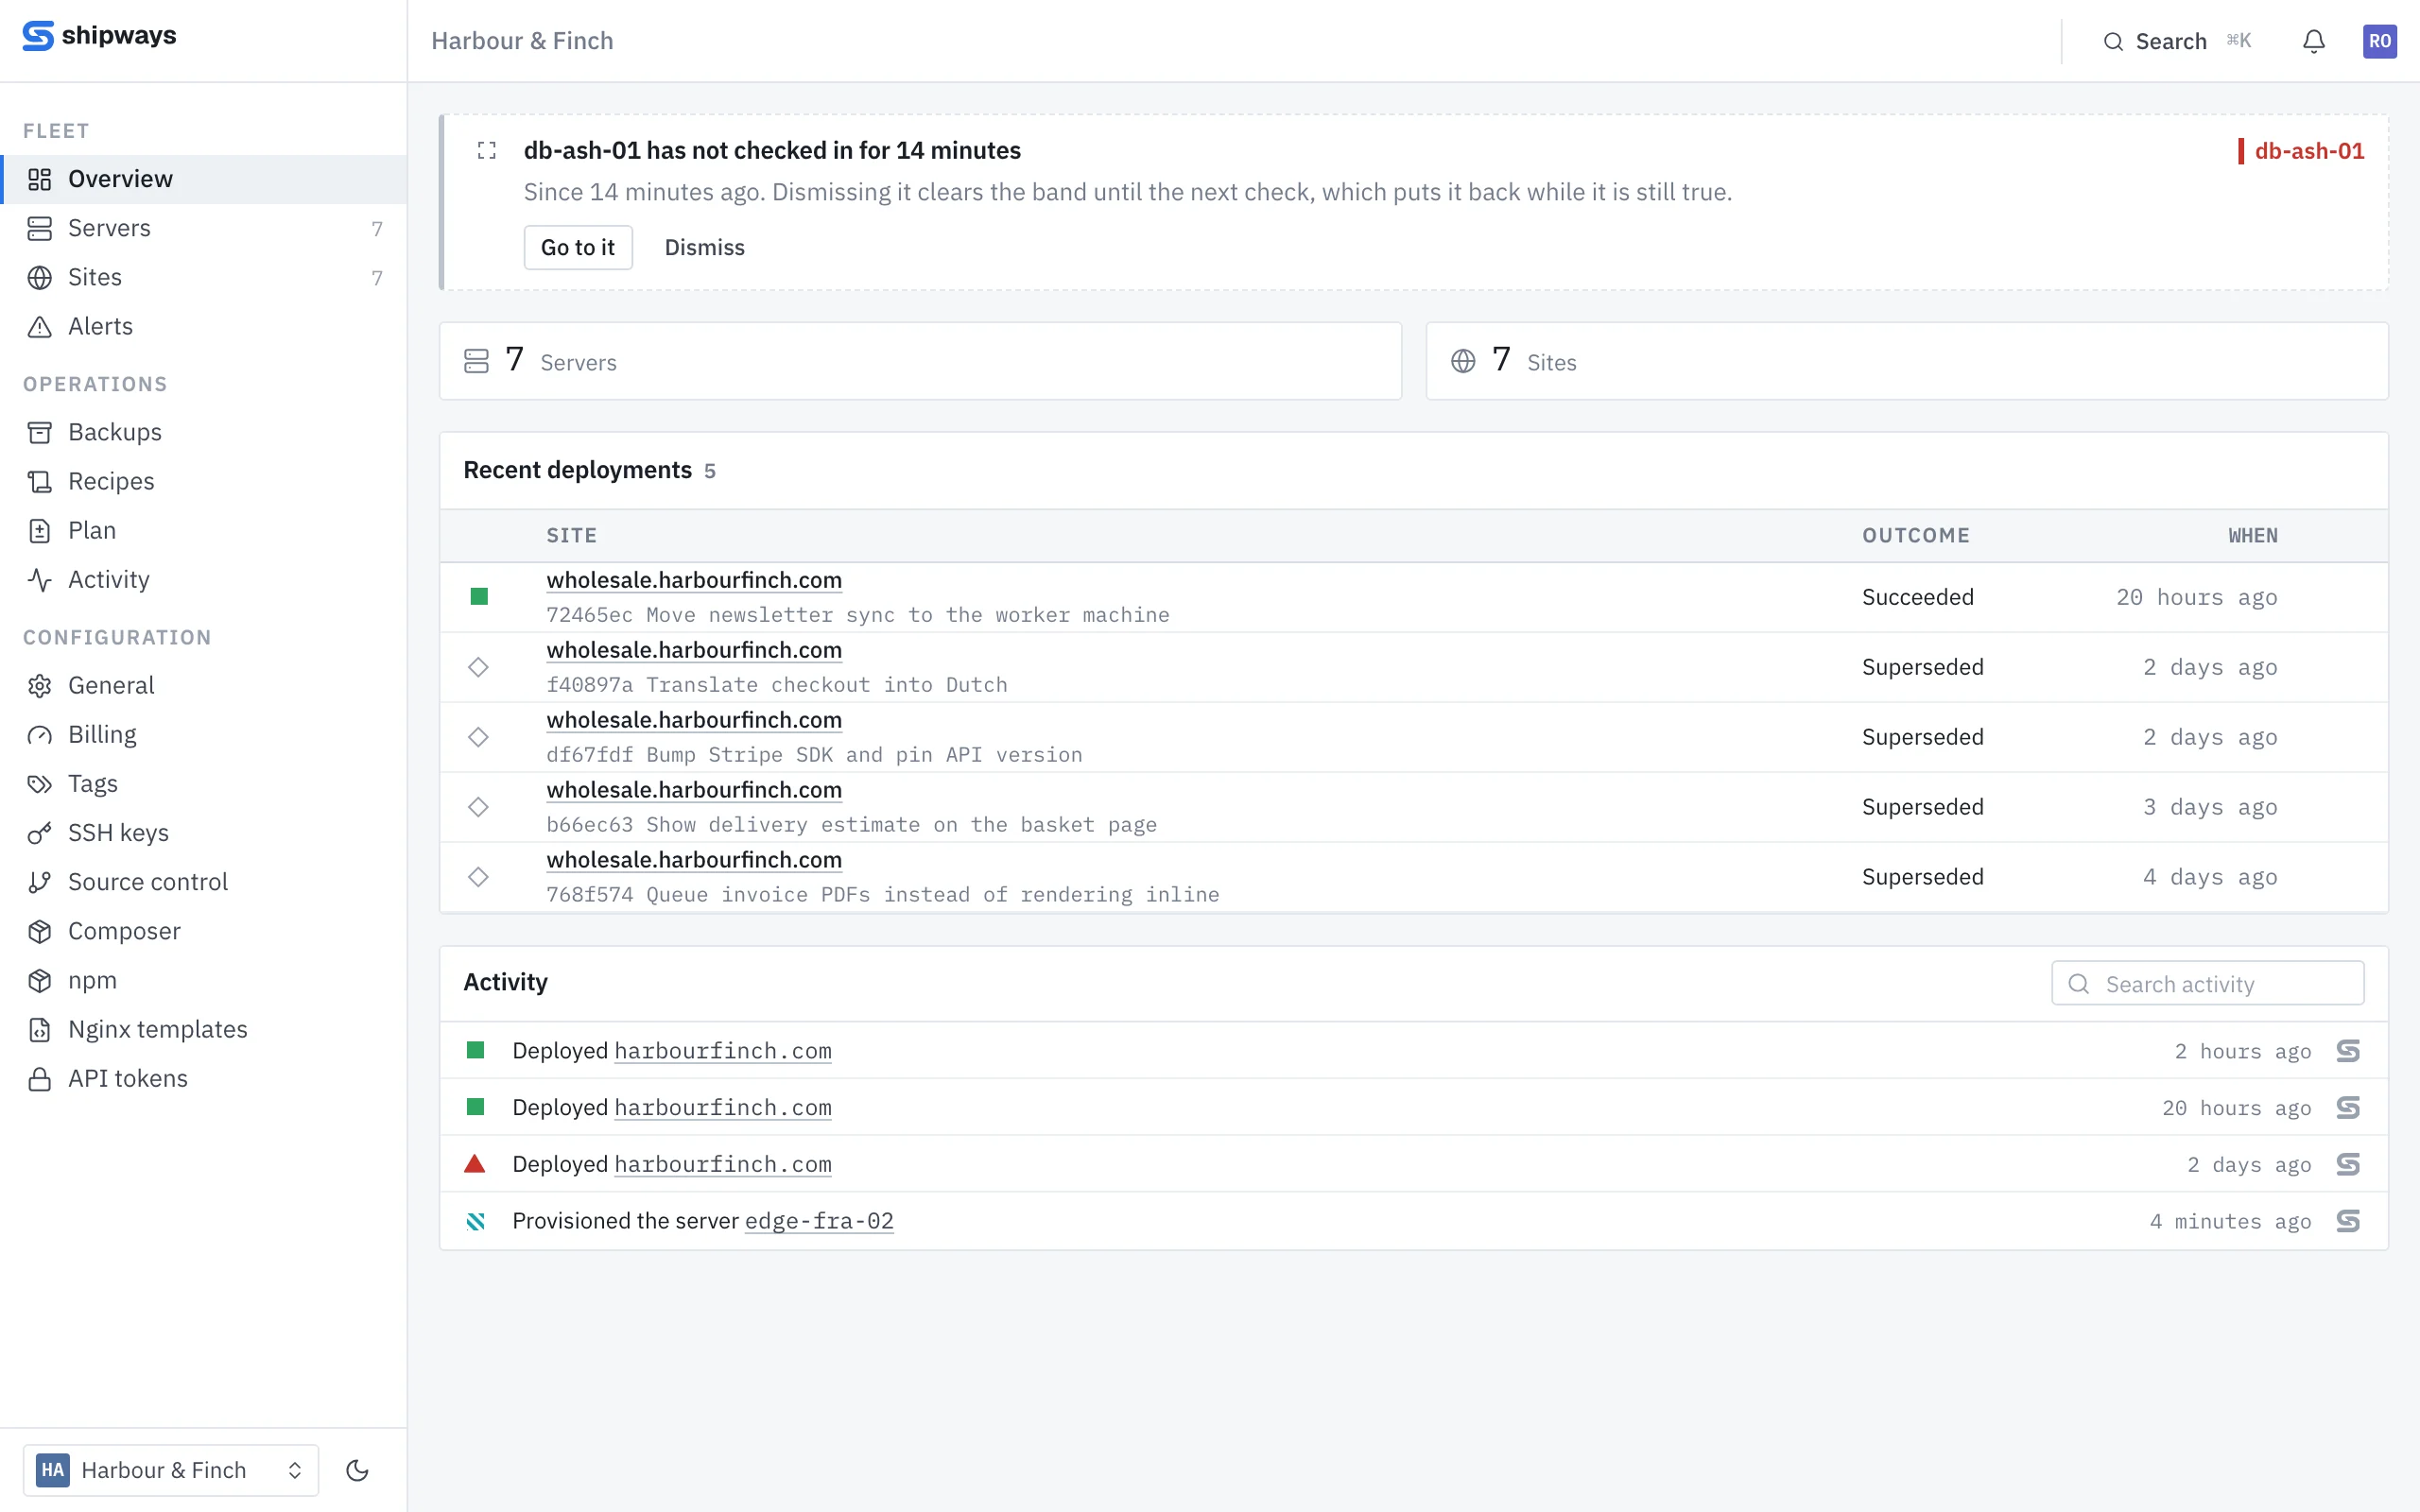
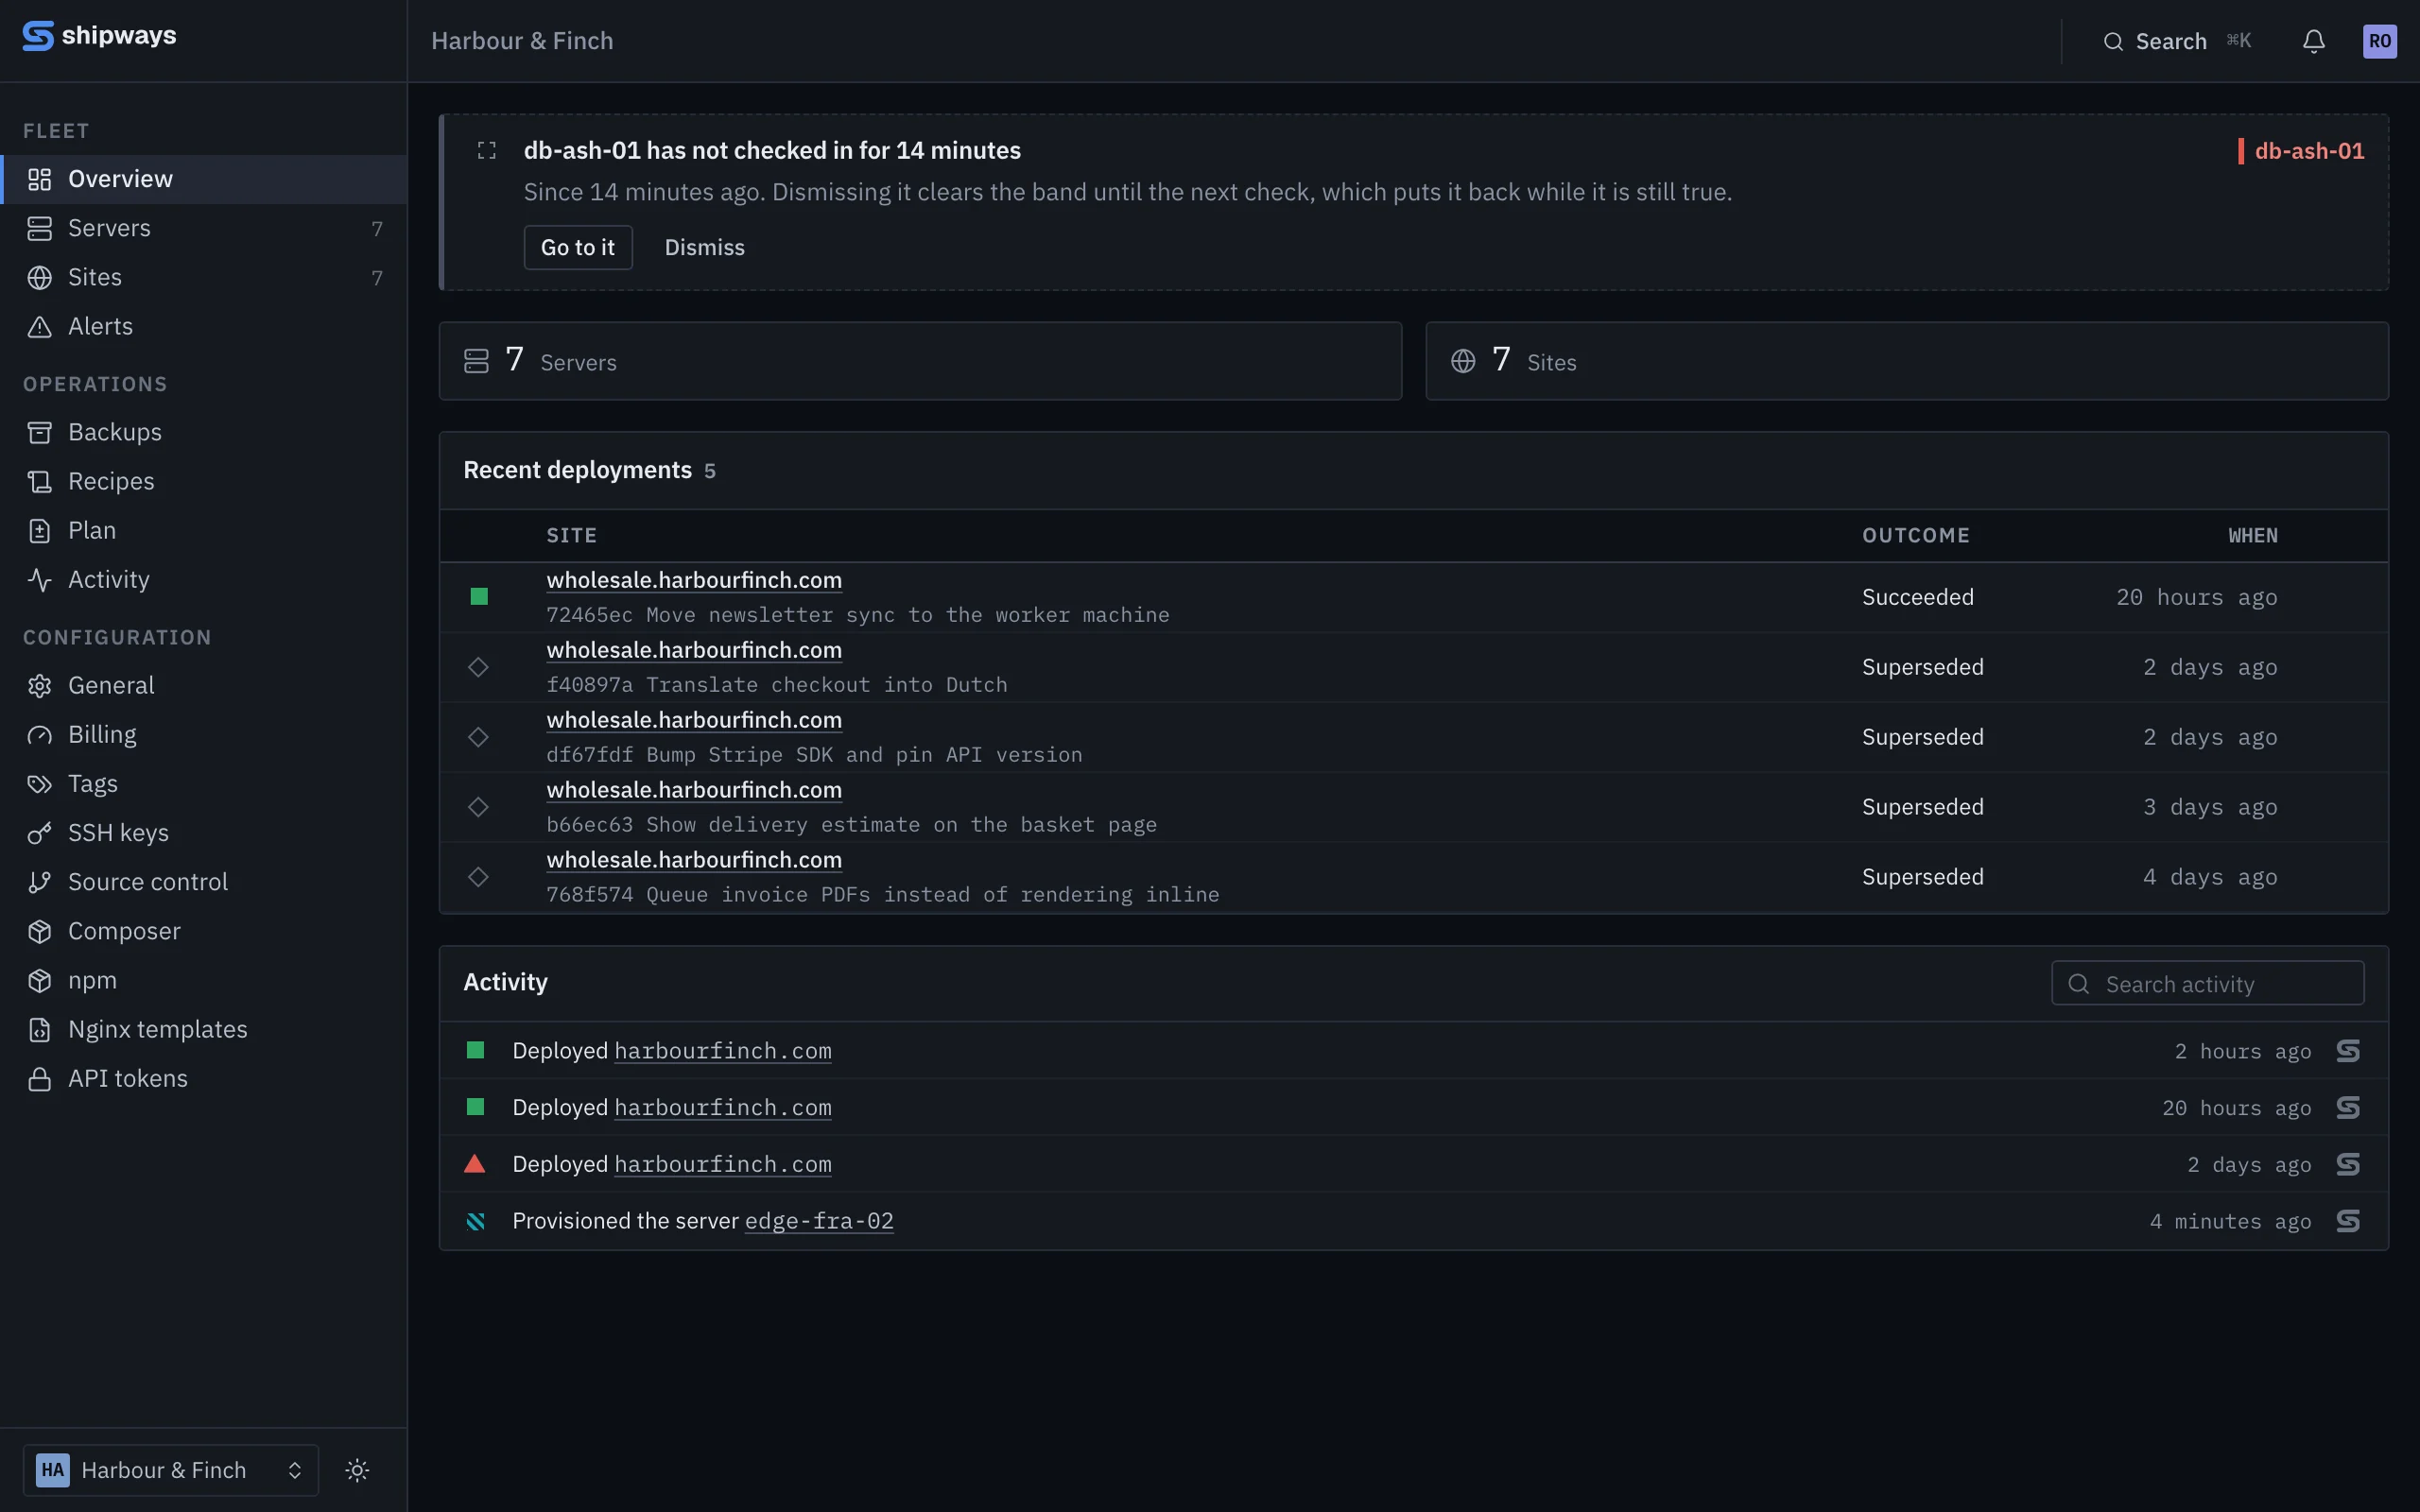
One alert per thing, opened once, closed when it clears
Checks run every five minutes. Most alerts close themselves when the condition clears; a failed deployment waits for somebody to acknowledge it.
The agent has not reported for two minutes.
Over the threshold for that machine.
Expiring within 14 days, or a renewal that failed.
A Supervisor program that is no longer running.
With the step that stopped and its last lines.
A backup that failed, or none for 36 hours.
Nothing is running what is queued, noticed even when the worker is dead.
A job that should have called in and did not.
Email, Slack, Discord, Mattermost or a webhook
Each destination chooses the alert types it receives and can be paused. Email needs no Shipways account at the other end, owners and admins are always told, and a site can follow the organization's destinations or keep its own.
{
  "event": "alert.opened",
  "text": "db-ash-01 has not checked in for 14 minutes",
  "alert": {
    "type": "agent.unreachable",
    "severity": "critical",
    "title": "db-ash-01 has not checked in for 14 minutes",
    "subject": "db-ash-01",
    "url": "https://console.shipways.dev/harbour-finch/servers/3"
  }
}
Noticing work that has stopped running
A failing job is loud; a job that has quietly stopped running is not. Give a heartbeat a name, an interval and a grace period, and call its address at the end of the job. Nothing arriving is the signal. It works from anything that can make an HTTP request, on a Shipways machine or not.
# nightly export, then tell Shipways it ran
0 2 * * * php artisan export:nightly \
  && curl -fsS https://console.shipways.dev/webhooks/heartbeat/<token>
One machine, free, for as long as you like
No card and no end date. Connect a spare box and watch it provision; everything it builds carries into whichever plan you move to.